


- BTC Short-term holder resistance aligns with whale accumulation and breakeven levels near $106.2K.
- Rising NVT and weakening momentum indicators signal caution despite on-chain bullish signals.
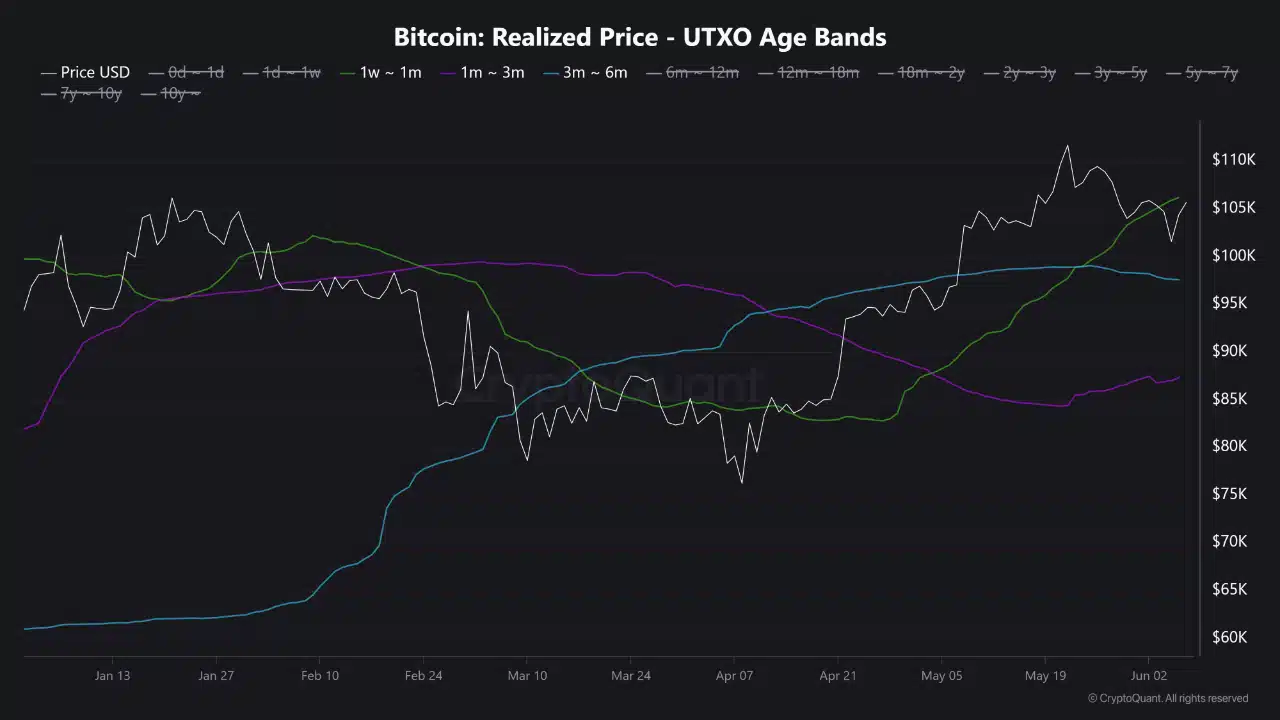
Bitcoin [BTC] short-term holders currently show distinct entry zones, with the 1-week to 4-week cohort averaging $106.2K, while those from 3 to 6 months sit near $97.5K.
This divergence sets up a crucial psychological battleground. As BTC traded near $105,606 at press time, those nearing breakeven may rush to sell, adding resistance near $106.2K.
However, buyers anticipating a dip might treat the $97.5K level as a discount zone.
This dynamic could determine whether Bitcoin breaks out or reverses downward, depending on which cohort dominates near-term price action.
Are whales signaling renewed confidence with this inflow-outflow flip?
IntoTheBlock data confirms a major behavioral shift: Large Holder Inflows spiked 254.46% in the past week, while Outflows fell 53.86%.
That’s a strong bullish divergence — showing whales are accumulating and holding, not exiting.
This inverse trend reflects a growing conviction that current prices offer value, especially with BTC consolidating under the $106K ceiling.
This behavior may provide enough liquidity support to reinforce the $97.5K level and potentially flip $106.2K into a breakout zone, provided this whale activity sustains.
Is BTC’s rising NVT ratio a warning sign for overvaluation?
BTC’s NVT Ratio has surged 55.38%, reaching 49.47—highlighting a widening gap between price and network transaction volume.
This sharp uptick suggests the market cap is expanding faster than the actual on-chain usage. Typically, such a divergence implies overvaluation and hints at reduced organic activity.
Of course, NVT spikes don’t guarantee a reversal. But when paired with weakening momentum signals, they often mark exhaustion at the top.
Does the stock-to-flow model still hold weight after a 25% drop?
The Stock-to-Flow ratio has dropped 25%, weakening BTC’s scarcity narrative.
As circulating supply dynamics lose influence, traders appear to shift focus toward real-time data like inflows, outflows, and cost basis levels.
This shift reflects a growing skepticism toward halving-driven valuation models, particularly as macro conditions and institutional liquidity play larger roles in price discovery.
Therefore, while stock-to-flow remains a long-term model, its short-term impact continues to fade.
Will momentum fade as Bitcoin compresses under critical resistance?
BTC remains trapped between an ascending trendline and the key resistance cluster near $106.2K. This level includes the short-term holder cost basis and the Fibonacci retracement zone.
Moreover, MACD shows signs of fading momentum, with a possible bearish crossover developing.
Together, these factors paint a picture of indecision. If bulls can’t reclaim control above $106K, the price risks falling toward $97.5K.
However, a strong breakout above $106.2K could clear the path toward $110K and beyond.
Can BTC break above resistance or will sellers take control?
BTC’s ability to reclaim $106,200 rests on whether whale inflows can outweigh breakeven sell pressure from recent buyers.
Right now, inflows look strong, but momentum is cooling.
If whales keep stacking and NVT stabilizes, a breakout is possible. If not, sellers may find an opening — and the $97,500 level will be tested once more.


